
🗽 New York City 🗽
Evolution Animation
An Animated Map Showing Urban Growth in the Five Boroughs of NYC
From 1609 to 2019
👇 🎥 👇
An Animated Map Showing Urban Growth in the Five Boroughs of NYC
From 1609 to 2019
👇 🎥 👇
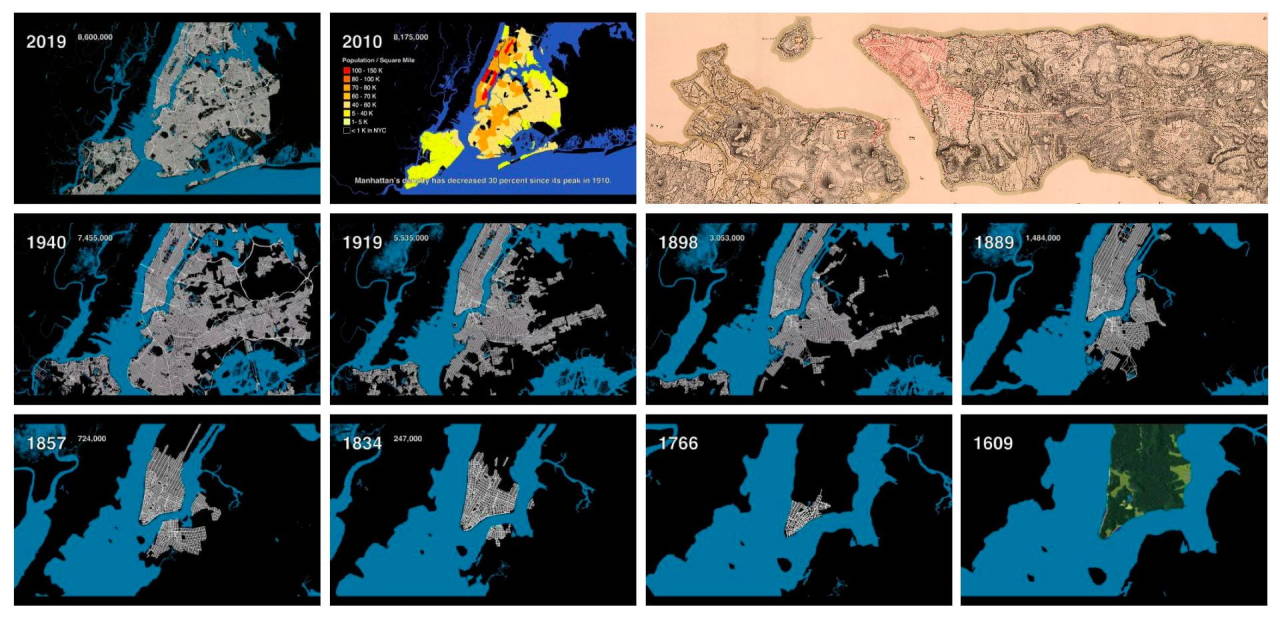
This animation illustrates the development of NYC’s street grid and infrastructure systems from 1609 to the present-day, using geo-referenced road network data and historic maps. The resulting short film presents a series of “cartographic snapshots” of NYC’s built-up urban area at intervals of every 20-30 years history.
Columbia University student Myles Zhang has created “Here Grows New York City”,
a really informative animated map showing the vast urban growth that took place within New York City and its surrounding boroughs of Queens, Brooklyn, the Bronx, and Staten Island from 1609 through 2019. While initial growth took place in lower Manhattan, it didn’t take long for the other four boroughs to catch up.
Research Methodology
Several hundred maps in the digital archives of the Library of Congress and New York Public Library
were analyzed to assemble this film. About 25 of these maps were then selected, downloaded, merged, stretched, and warped in a single document to align with each other. This provided a consistent scale and allowed easier comparison of differences between maps of different date. As the source files were all in different colors, scales, and designs, we created a single base map with unified graphics. The redrawing not only facilitates the review and correction of errors in the old cartographies, less accurate, but also provides a graphic representation that is consistent throughout all the stages. This coherence allows the cartographies to be real in parallel and compare the transformations experienced by the city.
Or watch the video below, where I walk through the work flow and software.
👇 🎥 👇
Here Grows New York Work Flow
Myles Zhang
👇 🎥 👇
Here Grows New York Work Flow
Myles Zhang
An Animated Map Showing Urban Growth in the Five Boroughs of New York City From 1609 to 2019
👇 🎥 👇
- Song Cities
- Artist Maserati
- Album The Language Of Cities
- Licensed to YouTube by The Orchard Music (on behalf of Kindercore); Audiam (Publishing), and 11 Music Rights Societies
Learn more about this project: https://www.myleszhang.org/here-grows-new-york-city
🗽 🗽 🗽 🗽 🗽 🗽 🗽 🗽 🗽 🗽 🗽 🗽
No comments:
Post a Comment